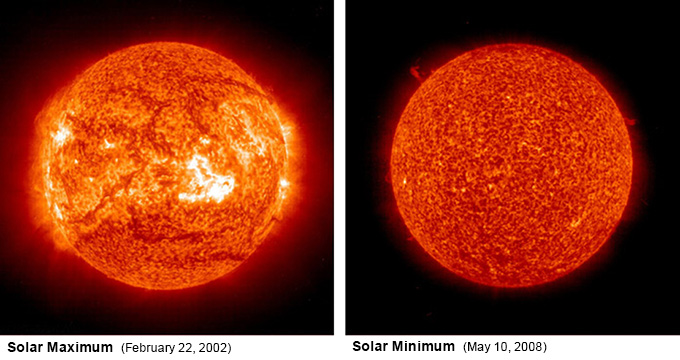
Ultraviolet light shows that activity on the sun’s surface changes between solar maximum (left) and solar minimum. Sunspots appear dark in visible light and bright in ultraviolet light. Credit: NASA Extreme Ultraviolet Explorer telescope images from the SOHO data archive
The sun may appear constant but, like most things in the universe, it’s constantly in flux—cycling between an active state, called a solar maximum, and a more restful one, called a solar minimum.
It alternates regularly between these about every 11 years.
During solar maxima, sunspots increase but so do solar flares, making these times of increased irradiance.
Higher-than-normal electromagnetic radiation causes geomagnetic storms on Earth that impact GPS systems, satellites, and power grids.
Charged particles emitted can be hazardous to astronauts and spacecraft electronics.
More X-rays and extreme UV radiate toward Earth, but most are absorbed by the outer atmosphere, called the thermosphere.
The increased energy causes the thermosphere to expand, interfering with the orbit of satellites.
Conversely, during solar minima, solar flares and charged particle emissions are rare.
This is generally good news, since it means fewer geomagnetic storms and lower solar radiation risk.
However, there’s less solar energy to form ozone in the middle atmosphere, which allows more sunburn-producing UVB to reach Earth’s surface.
And reduced solar wind means that more cosmic rays can reach Earth.
Both solar states pose unique challenges. But for the most part, our atmosphere reacts to the increasing or decreasing energy and continues to protect us.
Background
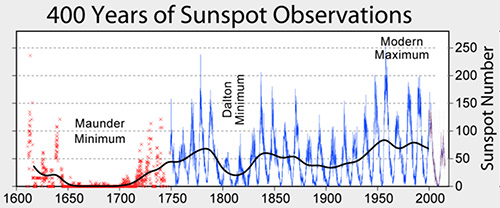
Compilation of sunspots counted monthly since 1750 (blue and purple), and counts recorded in scientific literature back to 1600 (red). The black line illustrates longer-term variability in solar activity. Credit: Robert A. Rohde (GFDL [http://www.gnu.org/copyleft/fdl.html] or CC-BY-SA-3.0 [http://creativecommons.org/licenses/by-sa/3.0/]), via Wikimedia Commons
Synopsis: Solar cycles occur with regularity—about every 11 years. But not all solar cycles are created equal; recent cycles have set records for the lowest activity in a century! How does this variation in solar activity impact us on Earth’s surface?
Earth’s sun cycles from calm solar minima to tempestuous solar maxima every 7–14 years, averaging about every 11 years. These cycles have been measured for centuries by counting sunspots.
Sunspots appear in visible light as pairs of dark spots with opposite polarity on the sun’s photosphere. The spots are cooler than adjacent areas because local magnetic field conditions reduce convection in the area.
Since 1750, the number of sunspots has been recorded each month, providing a long-term record of solar activity.
The record can be extended back to nearly 1600 using observations from scientific literature going back to the days of Galileo’s first sunspot observations.
Despite their regularity, the strength of solar cycles varies through time. Our last solar maximum, in 2014–2015, was the least intense in more than 100 years based on sunspot activity, and the preceding solar minimum in 2009 set a record, with no sunspots at all for more than 260 days.
Modern technology also allows us to see solar cycles by viewing ultraviolet radiation emission from our sun, in which sunspots appear bright.
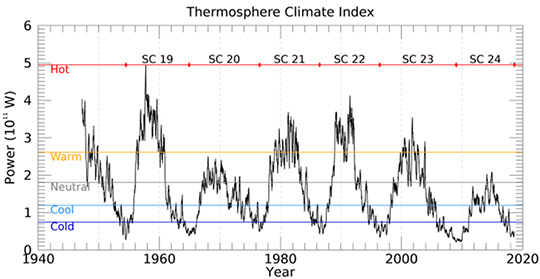
The thermal state of Earth’s uppermost atmosphere compares well with records of sunspot cyclicity, making it clear that solar activity heats Earth’s rarefied thermosphere.
One way scientists assess the thermal state of the upper atmosphere is by measuring infrared emissions from carbon dioxide (CO2) and nitric oxide (NO) using the Sounding of the Atmosphere using Broadband Emission Radiometry (SABER) instrument on NASA’s Thermosphere Ionosphere Mesosphere Energetics Dynamics (TIMED) satellite.
Launched in 2001, the satellite was only built to last 3 years but has now provided 18 years of data.
Recently, using the SABER instrument, NASA scientists have introduced a Thermosphere Climate Index (TCI) to record changes in solar radiation by measuring the number of watts of infrared heat radiated from the thermosphere by nitric oxide. They were able to extend the 18 years of SABER data back to 1940 using historical records of geomagnetic activity and UV output. The TCI index relates only to the state of the thermosphere, not to the climate at the surface of Earth.
In late 2018, the lowest point in our current cycle, SABER measured around 33 billion watts of infrared power from nitric oxide, about 10 percent of measurements made during typical solar maxima. But in the previous cycle, when records were set for sunspot-free days in 2009, the minimum infrared power recorded by SABER was even lower—just 21 billion watts.
A historical record of the Thermosphere Climate Index shows that the state of the thermosphere can be discussed using a set of five plain-language terms: Cold, Cool, Neutral, Warm, and Hot. Credit: Martin Mlynczak, NASA LangleyAlthough the sun itself is hot, solar radiation isn’t actually hot as it passes through the vacuum of space.
It is the electromagnetic energy, or light, that drives reactions between particles in Earth’s atmosphere, which produce thermal energy, or heat, as a byproduct.
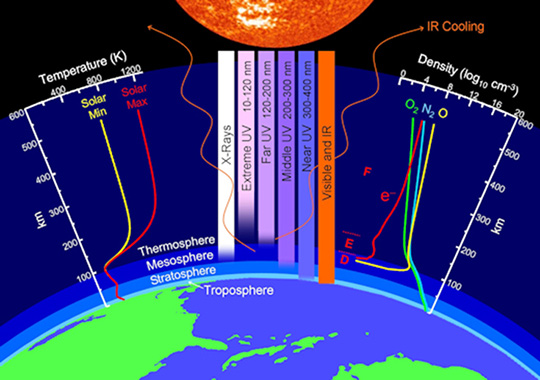
When solar radiation makes its way to Earth, it encounters the layers of our protective atmosphere: the thermosphere, where the International Space Station and many other spacecraft orbit; the icy cold mesosphere; the stratosphere, with its ozone layer; and the troposphere, where we live and where Earth’s weather occurs.
Properties of each of the layers influence incoming solar radiation, filtering out different electromagnetic wavelengths and producing heat from chemical reactions.
Solar maxima produce a greater discharge of electromagnetic radiation to the solar system than solar minima and are characterized by an increase in sunspots, solar wind velocity, solar flares, and coronal mass ejections (CMEs).
Geomagnetic storms that may adversely impact GPS systems, satellite communication, and power grids on Earth are more frequent during solar maxima.
Solar radiation from charged particles ejected toward Earth in CMEs is more of a risk for astronaut health and spacecraft electronics during this part of the cycle.
Solar maxima produce a disproportionate amount of short-wavelength radiation in the X-ray and ultraviolet parts (extreme EUV and far UVC) of the spectrum, but Earth’s thermosphere takes the brunt of these life-threatening emissions.
Increased electromagnetic energy increases reaction rates at the fringes of our atmosphere, causing chemical reactions that give off heat as charged particles recombine into compounds like NO.
The thermosphere expands as it heats up, increasing in density at a given altitude; accelerating orbital decay; and causing more wear and tear on satellites, which may occasionally require boosting to maintain their orbits.
The mesosphere and stratosphere absorb short-wavelength radiation that makes it through the thermosphere as well as progressively longer wavelengths, providing additional protection for life on Earth. The stratospheric ozone layer absorbs middle UVB, protecting us from sunburn.
During solar maxima, more-intense solar wind causes the heliosphere to expand, sheltering Earth from damaging cosmic rays.
Layers of the atmosphere have variable physical and chemical characteristics and protect Earth from solar radiation. Credit: NASASolar minima are distinguished by decreased solar emissions and a lower number of sunspots compared to solar maxima; sometimes weeks can go by without a sunspot.
Solar flares and CMEs are rare, resulting in a lower risk of geomagnetic storms and lower solar radiation risk for astronauts and spacecraft electronics.
With fewer reactions generating compounds and heat, the thermosphere contracts during solar minima, which decreases the overall thickness of Earth’s atmosphere and reduces satellite deterioration and orbital decay.
Studies have shown that more sunburn-producing UVB may also make its way to Earth’s surface during solar minima.
The concentration of ozone in the stratosphere is impaired when less overall UV radiation is available to split O2, a process critical for continuous regeneration of ozone (O3).
During solar minima, the protective heliosphere contracts as the solar wind abates, allowing more cosmic radiation to impact Earth.